As I said I would in the comments, here is what the humidity in my underground bunker looks like:
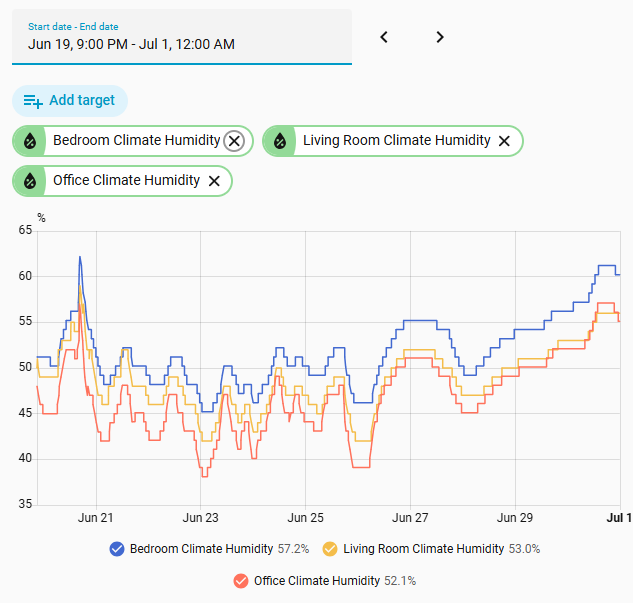
The spike at about 4:00 PM on the 20th was when Barb mopped the floors. The rise of the last few days is probably because of the rain. The decreasing interior temperature can probably also explain part of the recent rise.
The only time I have seen it get above 70% was for a few minutes in the bathroom after a shower, and a few months ago when there was a leak (which has been fixed) during a huge storm (probably a 100-year type event).
That certainly looks promising. The underground command posts I served in at Osan and Kunsan airbases both had extensive seasonal problems with condensation and then mold. Whenever humidity would significantly increase and the temperature would drop we would find surface condensation on walls and ceilings. The solution was strategically placed dehumidifiers. It worked so long as the civil engineering squadron maintained them properly. Hell hath no fury like a general who’s conference room / briefing room table experiences an indoor rainstorm during use